
Conversion Rate Benchmarks: Boosting Shopify Sales
More than half of American online stores report conversion rates under 3 percent, making every sale count in a crowded marketplace. For Shopify merchants, understanding where they stand against industry benchmarks unlocks the power to spot weaknesses and sharpen their sales funnel. This guide breaks down the numbers, explains why benchmarks matter, and reveals how the right focus can help any American business compete more effectively in the world of e-commerce.
Table of Contents
- What Are Conversion Rate Benchmarks?
- Common Conversion Rates in Ecommerce
- Key Drivers Shaping Shopify Conversion Rates
- Comparing Industry Standards Vs. Your Store
- Mistakes to Avoid When Using Benchmarks
Key Takeaways
| Point | Details |
|---|---|
| Understanding Conversion Rates | Conversion rates for Shopify typically range from 1% to 3%, with opportunities for improvement across various factors. |
| Importance of Benchmarking | Regularly compare your store’s performance against industry benchmarks to identify areas for optimization. |
| Key Drivers of Performance | Focus on website performance, user experience, and trust signals to enhance conversion rates and customer satisfaction. |
| Avoiding Misinterpretations | Use contextual analysis to interpret benchmarks accurately, taking into account unique characteristics of your business. |
What Are Conversion Rate Benchmarks?
Conversion rate benchmarks represent critical performance metrics that reveal how effectively an online store transforms website visitors into paying customers. These statistical measurements provide Shopify store owners a clear understanding of their sales funnel’s efficiency, comparing their performance against industry standards. Conversion metrics in e-commerce platforms highlight the complex relationship between user interactions and successful transactions.
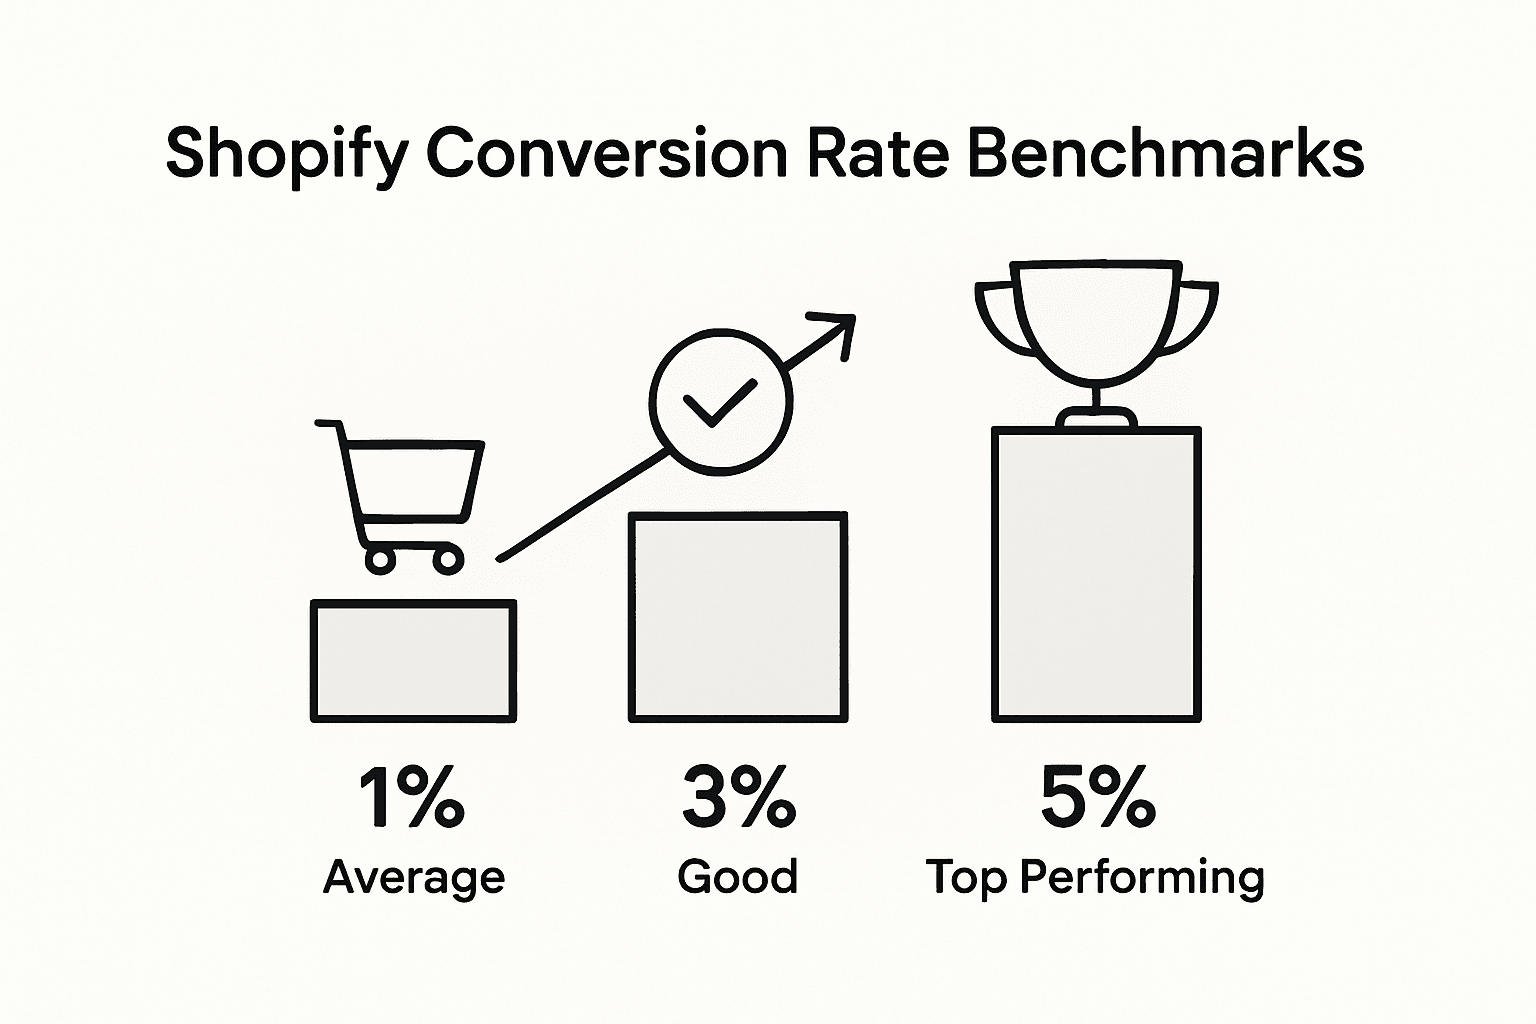
In the Shopify ecosystem, conversion rates typically range between 1% to 3%, though top-performing stores can achieve rates as high as 5%. These benchmarks help merchants understand their store’s performance relative to competitors and identify areas for strategic improvement. Factors influencing conversion rates include website design, product presentation, checkout process complexity, page load speed, and overall user experience.
Understanding conversion rate benchmarks involves analyzing multiple dimensions beyond simple purchase statistics. Conversion Rate Optimization (CRO) requires examining metrics like average order value, cart abandonment rates, and customer engagement levels. Research on purchase intentions demonstrates that user satisfaction directly correlates with higher conversion probabilities, underscoring the importance of creating seamless, intuitive shopping experiences.
Pro Tip: Systematic Tracking Strategy: Implement a monthly conversion rate tracking system that compares your store’s performance against industry benchmarks, allowing you to identify trends, measure improvements, and make data-driven optimization decisions.
Below is a summary comparing typical Shopify conversion rate benchmarks and the strategic implications for your business:
| Conversion Rate Level | Industry Benchmark | Business Implication |
|---|---|---|
| Below 1% | Low performers | Indicates major issues in user experience or targeting |
| 1% – 3% | Industry average | Aligns with most Shopify stores; improvement possible |
| 3% – 5% | Above average | Well-optimized funnel, strong competitive positioning |
| Over 5% | Top tier | Exceptional performance, likely strong brand loyalty |
Common Conversion Rates in Ecommerce
E-commerce conversion rates represent a critical metric for online retailers, reflecting the percentage of website visitors who complete a purchase. Global e-commerce benchmarks indicate significant variation across different product categories, with conversion rates typically ranging from 2% to 4% depending on industry and product type.
Various factors influence conversion rates across different e-commerce sectors. For instance, personal care products demonstrate higher conversion rates around 6.8%, while home decor experiences lower rates near 1.4%. These variations stem from multiple elements including product complexity, price point, customer trust, website design, and overall shopping experience. Industry-Specific Conversion Rates play a crucial role in understanding performance benchmarks.
Breakdown of typical conversion rates reveals nuanced insights across e-commerce segments:
- Fashion and apparel: 2.7% average conversion rate
- Electronics: 3.2% average conversion rate
- Beauty and cosmetics: 3.5% average conversion rate
- Home and furniture: 1.5% average conversion rate
- Health and wellness: 4.1% average conversion rate
Pro Tip: Strategic Benchmarking Approach: Regularly compare your Shopify store’s conversion rates against industry-specific benchmarks, focusing on targeted improvements in user experience, product presentation, and checkout process optimization.
Key Drivers Shaping Shopify Conversion Rates
Conversion rate optimization involves understanding the complex factors that influence online purchasing decisions. Technical performance metrics reveal that device type, traffic source, and browser compatibility significantly impact a Shopify store’s ability to convert visitors into customers. Mobile responsiveness and seamless cross-device experiences have become critical determinants of online sales success.

Customer satisfaction plays a pivotal role in driving conversion rates. Research indicates that marketing innovation and user experience directly correlate with customer retention and purchase likelihood. Key drivers include website design, product presentation, checkout process simplicity, page load speed, and trust-building elements such as customer reviews, secure payment options, and transparent shipping information.
Multiple interconnected factors shape Shopify conversion rates:
- Website Performance
- Mobile optimization
- Fast page loading times
- Responsive design
- User Experience
- Intuitive navigation
- Clear product descriptions
- High-quality product images
- Trust Signals
- Customer reviews
- Security badges
- Transparent pricing
- Marketing Strategies
- Targeted traffic sources
- Personalized product recommendations
- Effective email marketing
Pro Tip: Conversion Diagnostic Strategy: Conduct monthly comprehensive audits of your Shopify store’s performance metrics, systematically identifying and addressing potential barriers in your conversion funnel to incrementally improve user experience and sales potential.
The following table highlights how key conversion drivers impact both customer perception and store outcomes:
| Conversion Driver | Influence on Customer | Effect on Store Performance |
|---|---|---|
| Mobile Optimization | Easier shopping | Increased mobile sales |
| Transparent Pricing | Builds trust | Reduces cart abandonment |
| Product Reviews | Increases confidence | Higher checkout rates |
| Personalized Emails | Feels valued | Improved repeat purchases |
Comparing Industry Standards vs. Your Store
Understanding your Shopify store’s performance requires a strategic comparison against global e-commerce conversion benchmarks. The current industry standard hovers between 2.5% to 3% conversion rates, presenting a clear target for store owners seeking to evaluate their online sales effectiveness. While these numbers provide a baseline, individual store performance can significantly deviate based on specific factors like product category, target audience, and marketing strategies.
To effectively benchmark your store’s performance, consider a comprehensive analysis across multiple dimensions:
- Conversion Rate Comparison
- Calculate your current conversion rate
- Compare against industry average (2.5% – 3%)
- Identify specific gaps in performance
- Detailed Performance Metrics
- Average order value
- Cart abandonment rate
- Traffic source efficiency
- Customer acquisition cost
Performance Evaluation Strategies involve more than simply comparing raw conversion numbers. Successful store owners look beyond surface-level metrics to understand the underlying factors driving their sales performance. This means analyzing user behavior, website design effectiveness, product positioning, and customer experience holistically.
Pro Tip: Benchmarking Deep Dive: Create a monthly scorecard comparing your Shopify store’s key performance indicators against industry standards, using data-driven insights to prioritize optimization efforts and systematically improve conversion potential.
Mistakes to Avoid When Using Benchmarks
Conversion rate benchmarks provide valuable insights, but misinterpreting these metrics can lead to misguided business strategies. Conversion rate optimization statistics emphasize the critical importance of understanding the nuanced context behind raw numbers, warning against oversimplified interpretations of performance data.
Common mistakes Shopify store owners make when using benchmarks include:
- Blind Comparison
- Comparing against irrelevant industry standards
- Ignoring unique business characteristics
- Overlooking specific market segment differences
- Metric Misinterpretation
- Treating benchmarks as absolute goals
- Neglecting contextual factors
- Misunderstanding statistical significance
- Overlooking Contextual Factors
- Product type variations
- Target audience specifics
- Unique store positioning
Successful store owners recognize that benchmarks are guideposts, not rigid rules. Contextual Analysis involves understanding the underlying factors that drive conversion rates, including customer demographics, product complexity, pricing strategies, and overall market dynamics. Each Shopify store represents a unique ecosystem with its own set of challenges and opportunities, making direct comparisons potentially misleading.
Pro Tip: Benchmark Wisdom: Develop a nuanced approach to benchmarking by creating a customized performance framework that considers your store’s specific characteristics, market positioning, and unique customer value proposition.
Unlock Higher Shopify Conversion Rates with AI-Powered Optimization
The article highlights the challenge many Shopify store owners face in understanding and improving their conversion rate benchmarks amidst complex factors like website performance, user experience, and marketing strategies. If you feel stuck trying to close the gap between your current conversion rates and industry leaders a powerful, data-driven approach is essential. Automagic.li offers a proven solution by delivering over 40 ready-made, high-impact A/B tests tailored specifically for Shopify stores — no coding needed. This means you can systematically address key pain points such as cart abandonment, poor mobile optimization, and unclear product presentation with ease and confidence.
Transform your store’s performance by leveraging AI to automate testing and gain actionable insights. With Automagic.li, you get a seamless way to apply industry best practices like transparent pricing, personalized product recommendations, and faster page loads that the article calls critical. Stop guessing what works and start optimizing with certainty.
Take the first step toward boosting your Shopify sales today by exploring how AI-driven conversion rate optimization can help you beat average benchmarks.
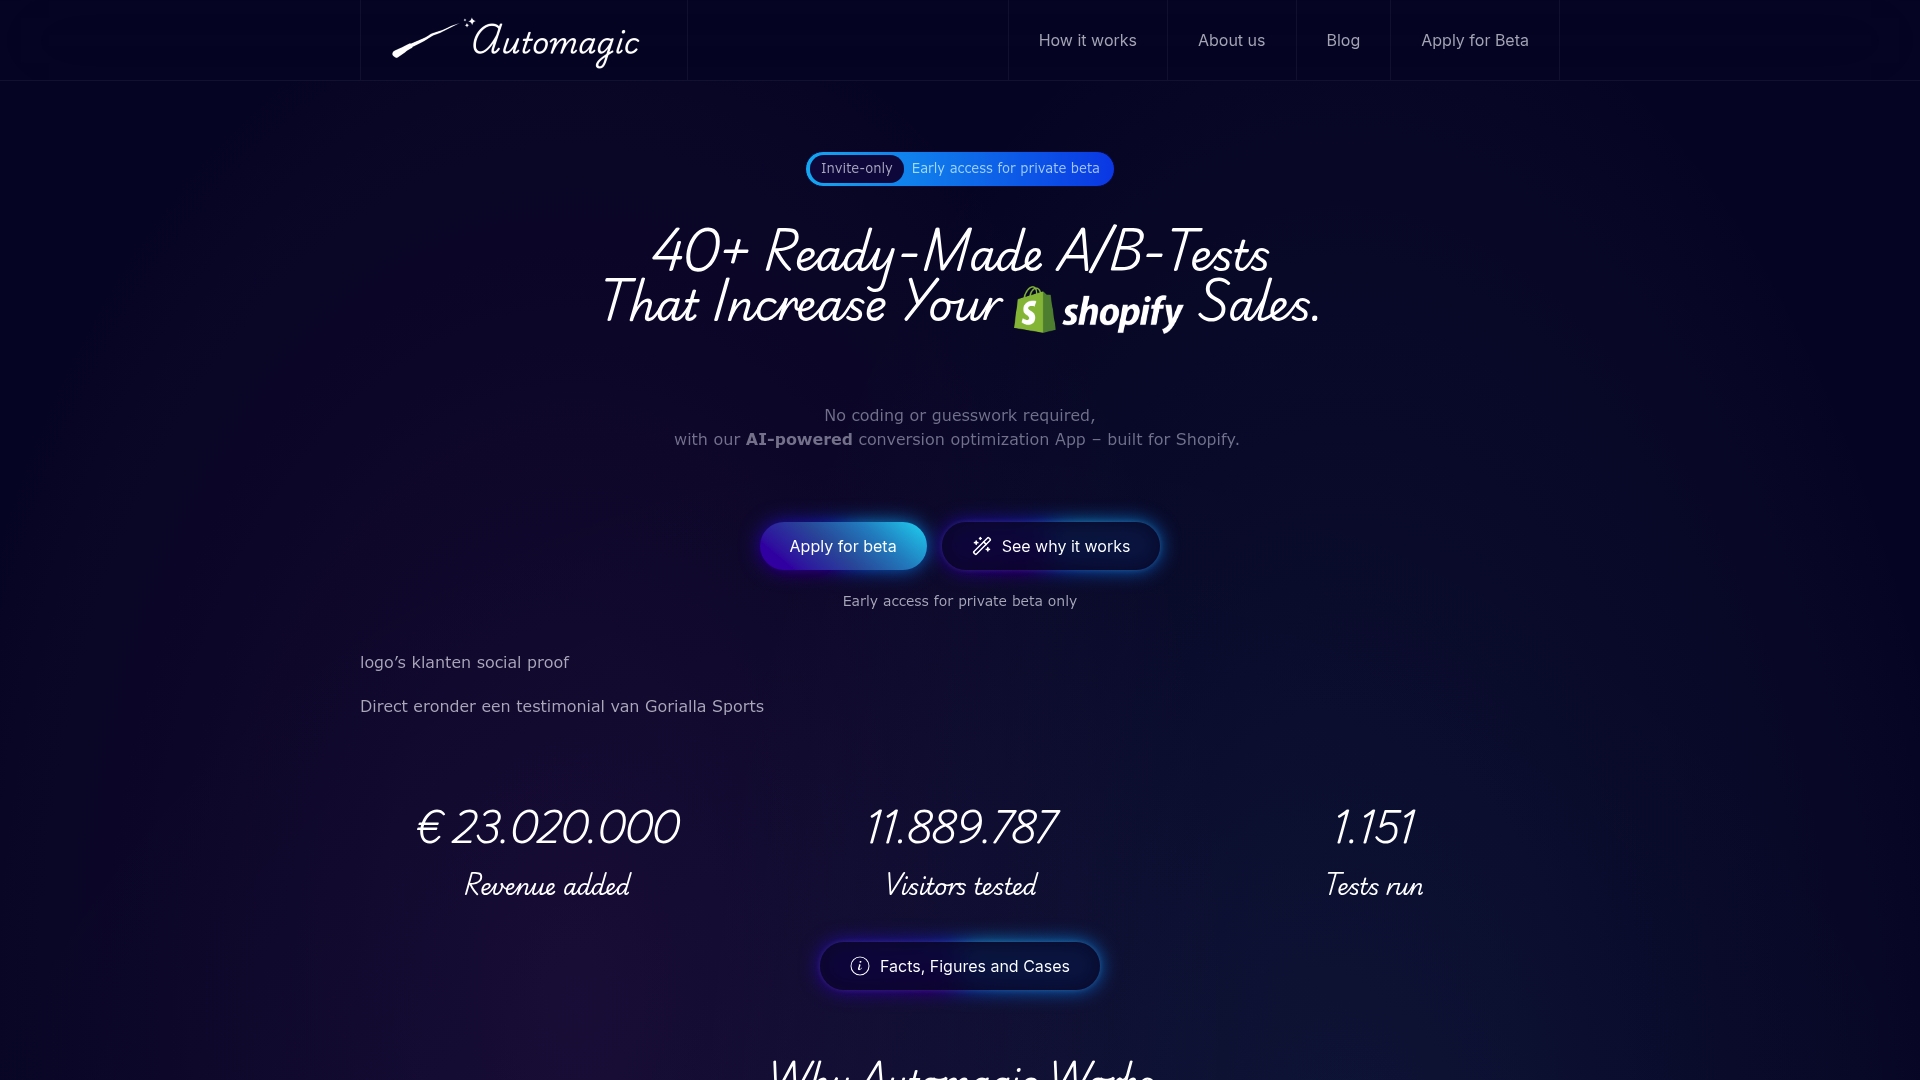
Ready to elevate your Shopify store’s conversion rates and leave low performance behind Visit https://automagic.li now to unlock your store’s true sales potential with effortless, impactful A/B testing.
Frequently Asked Questions
What are conversion rate benchmarks for Shopify stores?
Conversion rate benchmarks for Shopify stores typically range from 1% to 3%, with top-performing stores achieving rates as high as 5%. These benchmarks help store owners gauge their performance against industry standards and identify areas for improvement.
How can I improve my Shopify store’s conversion rate?
To improve your Shopify store’s conversion rate, focus on optimizing website design, enhancing product presentation, simplifying the checkout process, and improving overall user experience. Additionally, implementing strategies like faster page load times and building trust through customer reviews and secure payment options can help.
What factors influence conversion rates in e-commerce?
Several factors influence conversion rates in e-commerce, including website performance (like mobile optimization), user experience (intuitive navigation and clear product descriptions), trust signals (customer reviews and security badges), and effective marketing strategies (targeted traffic and personalized recommendations).
How do I track my conversion rate effectively?
To track your conversion rate effectively, implement a monthly tracking system that compares your store’s conversion rate against industry benchmarks. Analyze metrics such as average order value, cart abandonment rates, and customer engagement levels to identify trends and make informed optimization decisions.